🎯 Summary of Content:
In 2026, Bali property prices reflect a maturing, multi-tiered market. Premium Land prices (asking) in tourism hubs like Canggu typically list between IDR 9–14 Million/m² ($530–$825), while high-growth areas like Uluwatu offer development-ready land at IDR 5–8 Million/m² ($295–$470). For built villas, entry-level units in value markets (e.g., Ubud) start around $1,060/m², while premium markets (e.g., Canggu) typically start near $1,475/m². In contrast, luxury resort units (upper-tier managed assets) command $3,500–$4,150 per m², driven by superior yields and professional management.
- The “Gap” is Widening: There is now a massive valuation divergence between “Standard” local construction ($355/m²) and “Luxury” specifications ($900+/m²). Buyers must stop looking at generic “averages” and start pricing assets based on build quality, which dictates future resale value.
- Uluwatu is the New Growth Engine: The data shows a clear arbitrage opportunity. While Canggu prices have stabilized due to saturation, Uluwatu land remains ~40% cheaper despite commanding similar (or higher) nightly rental rates. This “lower entry, high ceiling” dynamic offers the strongest ROI potential in 2026.
- The “Managed Asset” Premium: The market has shifted toward “Lock and Leave” investments. Managed apartments command a premium (approx. $3,300/m² vs. $1,800/m² for villas) because they include extensive amenities, security, and professional management.
- The “Cost of Waiting” was High: Historical data confirms that “timing the market” has been expensive. Between Q1 2024 and Q1 2025 alone, average villa prices surged +51%. Investors waiting for a crash have simply faced a higher entry barrier.
- Leasehold is the Foreign Standard: Foreign ownership is predominantly structured via Leasehold or PT PMA rather than Freehold. Investors comparing prices must calculate the Annualized Cost of the lease to get a true “apples-to-apples” valuation.
- Budget Reality Check ($150k Threshold): Buying power has shifted. In 2026, a budget of $150,000 in Canggu buys a small renovation project or short-lease studio. In contrast, that same capital in Uluwatu still secures a luxury-grade investment suite in a high-growth resort (starting ~$95,000).
- Hidden Costs Impact Net Yield: The “Sticker Price” is not the final price. Investors must factor in ~6–7% for resale transaction costs (BPHTB + Notary) or ~16–17% for new developer units (due to VAT). Failing to model this kills projected returns. (Source: “Calculating the Real Price” section)
- Zoning is the New Risk: Government enforcement on spatial planning (ITR) is stricter than ever (e.g., the July 2025 Bingin crackdown). Safe capital only flows into “Pink” (Tourism) or “Yellow” (Residential) zones; investing in “Green Zones” is no longer a viable strategy.
Written by: Rasmus Holst – Founder & CEO of Coco Development Group | Reviewed by: Head of Investment & Market Analysis at COCO Development Group | Last updated: 12 March 2026
Transparency: COCO Development Group actively develops and sells property in Uluwatu. We are bullish on this region and have a commercial interest in its growth. This report uses independent data (REID, Bank Indonesia) to explain the market fundamentals driving that conviction, but investors should view our “Supply Forecasts” as proprietary internal estimates, not public fact.
Table of Contents
- Introduction
- The “Bali Premium”: Understanding Price Tiers
- The Cost of Waiting: The 2024–2025 Surge
- Land Prices 2026: The Foundation
- Built Property Prices: Villas & Apartments
- “What Can I Buy For…?”: Budget Scenarios
- Uluwatu vs. Canggu: The ROI Arbitrage
- Construction Costs: The Quality Gap
- Calculating the “Real” Price (Hidden Costs)
- Limitations, Alternatives & Professional Guidance
- Methodology
- Conclusion
- Frequently Asked Questions (FAQ)
- References & Official Sources
Introduction

If you asked an investor about Bali property prices five years ago, the answer would have been simple: “Cheap.”
In 2026, the answer is “It depends.”
The Bali market has matured into a complex ecosystem. You now have ultra-premium zones like Seminyak and Batu Bolong trading at prices comparable to parts of Southern Europe, while just 30 minutes away, emerging districts offer land at a 60% discount.
For foreign investors, the danger in 2026 is no longer just “buying a bad villa” – it is overpaying for land in a saturated zone or failing to understand the premium commanded by managed apartments over standalone villas. Buying at the top of the market (Canggu) significantly extends your ROI payback period.
This report breaks down the exact price per square meter for both land and built properties across Bali’s key investment corridors.
⚖️ First time buyer? Before analyzing prices, ensure you understand the legal roadmap with our complete guide on Buying Property in Bali: The Ultimate Foreigner’s Guide
The “Bali Premium”: Understanding Price Tiers

Before looking at the raw numbers, investors must understand the three “Price Tiers” currently dictating the market.
1. The Saturation Tier (Canggu, Berawa, Pererenan)
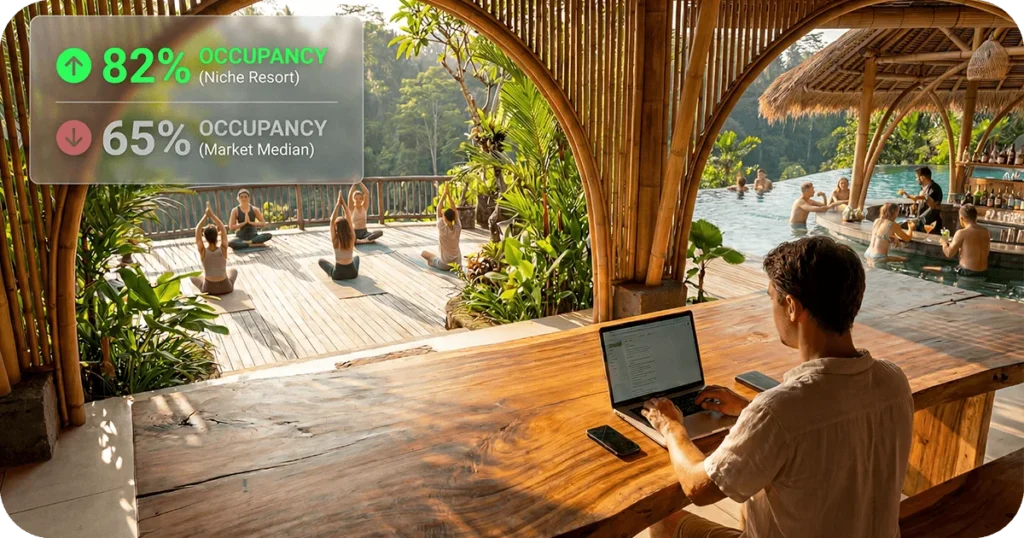
These areas have reached peak density. Prices here are driven by brand recognition and hype. While occupancy is high, the entry price is aggressive, meaning your rental yield percentage is often lower than in developing areas.
- Investment Profile: High Stability, Lower Yields.
2. The Growth Tier (Uluwatu, Pecatu, Bingin)
We are observing a distinct shift in institutional development focus toward the Bukit Peninsula (Uluwatu), supported by rising project announcements and permitting activity. Infrastructure is improving (new roads), luxury resorts are opening, but land prices still lag behind Canggu. This gap represents the “profit corridor” for developers and investors.
- Investment Profile: High Capital Appreciation, High Yields.
3. The Value Tier (Ubud, Sanur, Kedungu)
Established but quieter markets. These areas offer stability and significantly lower entry costs, but they lack the explosive nightly rates of the south coast.
Investment Profile: Low Entry Cost, Moderate Yields.
The Cost of Waiting: The 2024–2025 Surge

Is it better to wait for prices to drop? Market data suggests that “waiting” is the most expensive strategy of all.
Between Q1 2024 and Q1 2025 alone, Bali saw a massive correction in asset values as tourism numbers stabilized.
Data Note: The average villa price jumped from ~$321,000 to ~$484,000 in just 12 months (REID Data).
The Takeaway: While the explosive “post-COVID bounce” in Canggu has stabilized, the growth curve in Uluwatu is following a similar trajectory, just at an earlier stage.
Land Prices 2026: The Foundation

The following data represents the median asking prices for freehold/leasehold land in Q1 2026. Note that in Bali, land size is often measured in “Are” (1 Are = 100 m²).

⚠️ Market Reality: These figures reflect Asking Prices from market listings. Actual Transacted Prices (what buyers actually pay) are typically 5–15% lower after negotiation, depending on urgency and payment terms. Freehold (SHM) pricing is included for local market comparables; foreign buyers typically transact via leasehold or company-based rights.
1. Canggu & Berawa (The Peak)
Our Q1 listing tracking indicates that pricing in Canggu has stabilized after the post-pandemic surge, with median asking prices moving just +1.1% QoQ (Q4 2025 → Q1 2026). Note that these prices apply to ITR Tourism/Residential Zones (buildable land).
- Sample Depth: ~50+ active listings (captured Jan 15, 2026).
- Methodology: Aggregated from active listings (Rumah123). Filters: Tourism/Residential Zones only (Zoning was verified via ITR map checks; listings without verifiable zoning were excluded), >25-year lease terms, outliers (percentile/IQR) removed. Leasehold listings were filtered to >25 years; freehold comparables were included separately where available. Exchange rate: 16,981 IDR/USD.
- Market Status: Saturated.
- The “Liquidity” Premium: Despite lower yields (8–12%), Canggu remains the undisputed king of liquidity. If you need to sell your asset quickly, the sheer volume of buyer demand here makes it the safest exit strategy on the island. You pay a premium for this stability.
- Risk: Overpaying for “hype.” Traffic congestion is affecting long-term tenant retention.
2. Seminyak & Petitenget (The Established)
Seminyak is the “Old Money” of Bali. It is fully developed, stable, and commands the highest rates for established luxury.
- Sample Depth: ~15+ active listings (captured Jan 15, 2026).
- Methodology: Aggregated from active listings (Rumah123). Filters: Tourism Zones only (Zoning was verified via ITR map checks; listings without verifiable zoning were excluded), outliers (percentile/IQR) removed. Leasehold listings were filtered to >25 years; freehold comparables were included separately where available. Exchange rate: 16,981 IDR/USD.
- Market Status: Mature.
- Risk: Limited inventory. Most “buying” opportunities are actually leasehold takeovers of older buildings.
3. Uluwatu & Pecatu (The Opportunity)
Uluwatu offers the unique combination of premium cliff-front tourism with development land that is still 40-50% cheaper than Seminyak.
- Sample Depth: ~40+ active listings (captured Jan 15, 2026).
- Methodology: Aggregated from active listings (Rumah123). Filters: Tourism Zones only (Zoning was verified via ITR map checks; listings without verifiable zoning were excluded), outliers (percentile/IQR) removed. Leasehold listings were filtered to >25 years; freehold comparables were included separately where available. Exchange rate: 16,981 IDR/USD.
- Market Status: High Growth.
- Risk: Zoning is strict. You must ensure your land is in the “Pink Zone” (Tourism) to operate a rental.
- Infrastructure Reality: The “Development Premium” exists for a reason. Unlike Seminyak’s established grid, Uluwatu faces ongoing infrastructure growing pains, particularly with water truck reliance in dry seasons and road congestion on Jalan Uluwatu. Investors here accept these temporary operational friction points in exchange for significantly higher capital appreciation.
4. Ubud (The Cultural Hub)
Ubud operates on a different cycle. It attracts long-term digital nomads and wellness tourists. Land is significantly cheaper, but building densities are lower.
- Sample Depth: ~25+ active listings (captured Jan 15, 2026).
- Methodology: Aggregated from active listings (Rumah123). Filters: Tourism Zones only (Zoning was verified via ITR map checks; listings without verifiable zoning were excluded), outliers (percentile/IQR) removed. Leasehold listings were filtered to >25 years; freehold comparables were included separately where available. Exchange rate: 16,981 IDR/USD.
5. Sanur (The Expat Favorite)
Sanur is the preferred location for retirees and families. It is a stable, flat market with consistent but moderate growth.
- Sample Depth: ~20+ active listings (captured Jan 15, 2026).
- Methodology: Aggregated from active listings (Rumah123). Filters: Tourism Zones only (Zoning was verified via ITR map checks; listings without verifiable zoning were excluded), outliers (percentile/IQR) removed. Leasehold listings were filtered to >25 years; freehold comparables were included separately where available. Exchange rate: 16,981 IDR/USD.
Built Property Prices: Villas & Apartments

Buying land is only step one. For many investors, purchasing a turnkey villa or an off-plan apartment is the preferred route. In 2026, we see a distinct “Managed Premium” emerging, where apartments and resort units trade at higher values per square meter than standalone villas due to their passive income nature.
The Villa Market (Standalone)
Prices below reflect the Total Price per Square Meter of Building Area (Asking Prices).
- Sample Depth: 40+ verified listings (Canggu), 25+ listings (Seminyak). Filters: Completed/Furnished units, Tourism zoning. Source: REID Q1 2026. Exchange rate: 16,981 IDR/USD.
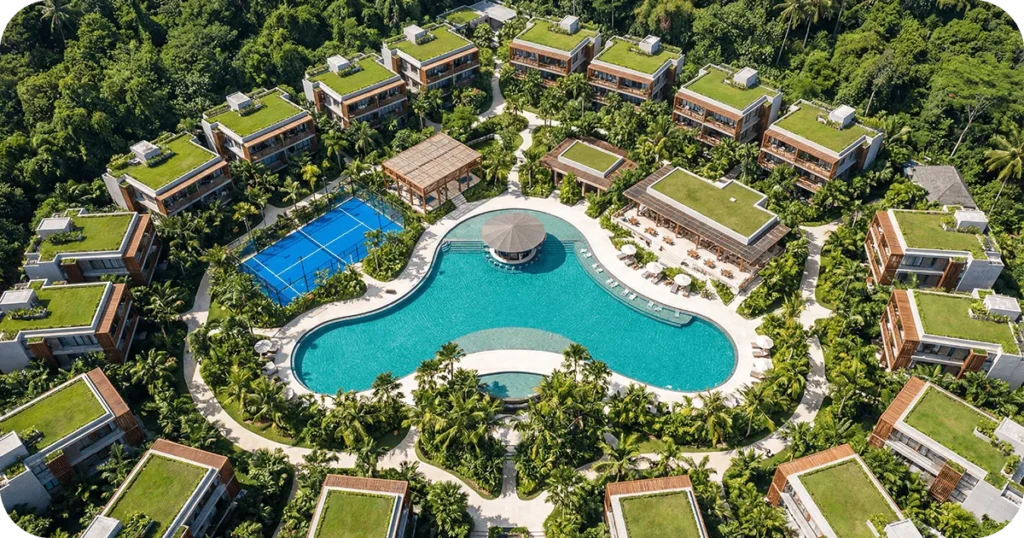
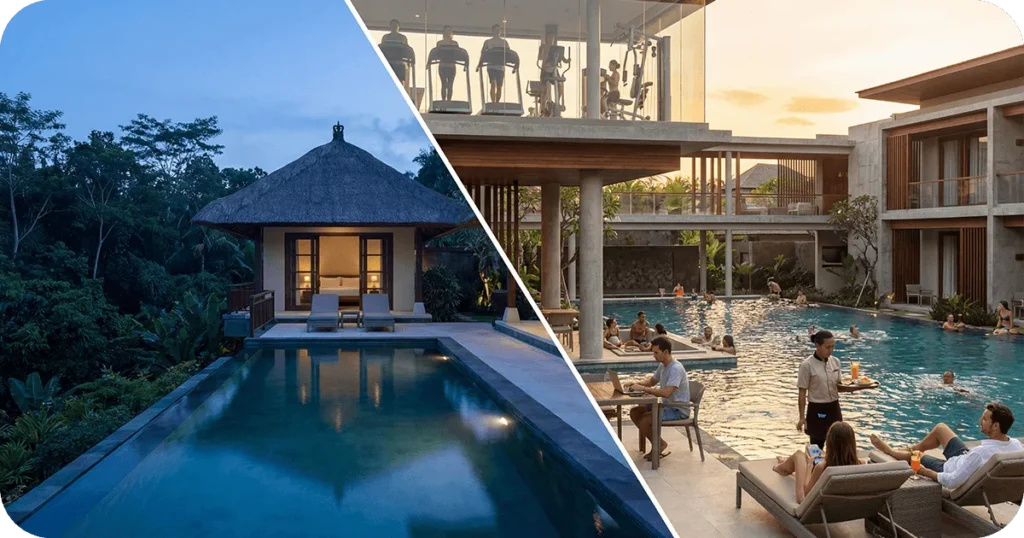
The Apartment & Resort Market (Managed Assets)
Our comparative market analysis shows managed units commanding a ~55% premium over standard villas. This reflects the “Lock and Leave” convenience, security, and shared amenities (gyms, coworking, massive pools) that standalone villas rarely offer.
- Methodology: Median asking prices from REID report Q1 2026. Filters: Commercial/Tourism zoning, managed complexes. Exchange rate: 16,981 IDR/USD.
“What Can I Buy For…?”: Budget Scenarios

A price per square meter is abstract. Here is what your budget actually buys you in the 2026 market.
Budget: Under $150,000 (~€142,000)
- The Canggu Reality: A very small leasehold studio (25-30m²) in a secondary location, or a “renovation project” with a short lease (<15 years).
- The Uluwatu Opportunity: A luxury resort suite in a high-growth zone.
- Market Price: ~€90,000 (approx. $95,000).
- Value: At this price, you can secure a fully managed asset with Luxury Grade construction ($900+/m² spec) – a product quality that typically requires a $250k+ budget to build yourself.
Budget: $250,000 – $350,000
- Canggu: A standard 2-bedroom villa on a small plot (Are). Likely not beachfront.
- Uluwatu: A premium 1-2 bedroom cliff-side villa or a large luxury apartment with ocean views and full amenities.
Budget: $500,000+
- Canggu: A luxury 3-bedroom villa in a prime zone (Batu Bolong), likely with high noise levels.
- Uluwatu: A trophy asset. A large cliff-front villa with unblockable sunset views and high-end architectural finishes.
Uluwatu vs. Canggu: The ROI Arbitrage

Why do investors and developers focus on Uluwatu? The answer is in the math.
When you buy a built villa in Canggu, you are paying $1,500 – $4,000 per m². The market is saturated with supply, which puts downward pressure on occupancy and rates.
In Uluwatu, we observe a market where land is cheaper, yet luxury demand is outpacing supply.
- Lower Entry: Uluwatu land is ~40% cheaper than Canggu.
- Higher Ceiling: Cliff-front rentals in Uluwatu achieve some of the highest nightly rates on the island (e.g., $500/night for luxury units).
- The Result: A wider margin for capital appreciation and rental yield.
- Supply Forecast: (Source: COCO Internal Market Analysis Q1 2026; projected 15% inventory deficit through 2027 based on active PBG construction permits vs. luxury arrival targets). This model compared active PBG construction permits, specifically for Class-A Waterfront properties´, against luxury arrival targets based on Regional Tourism Board projections and 2025 flight capacity data. The analysis confirms that current development pipelines are insufficient to meet the inbound demand from high-net-worth travelers.
📈 Interested in the ROI? See the full financial breakdown in our report on Bali Property Investment
The Verdict: Which Market Matches Your Profile?

High yields are attractive, but they aren’t the only metric. We advise clients to align their location with their financial personality:
The “Liquidity First” Investor → Buy in Canggu/Seminyak
- Goal: Wealth preservation and instant exit options.
- Profile: You want a “blue-chip” asset. You accept a lower yield (8-12%) in exchange for knowing there is a massive pool of buyers ready to snap up your villa if you need to sell in 2 weeks.
📍 The “Growth & Yield” Investor → Buy in Uluwatu
- Goal: Aggressive capital appreciation and maximum cash flow.
- Profile: You are willing to enter a developing market before it fully matures. You understand that infrastructure (roads/water) is still catching up to demand, but you view this gap as the profit margin that will close over the next 3-5 years.
Construction Costs: The Quality Gap

The prices above cover the market value (Land + Build + Developer Margin). If you decide to build yourself, you pay the Construction Cost directly.
However, be careful with averages. In 2026, there is a massive gap between “Standard” local builds and “International” luxury standards.
- Standard Villa: $355 – $470 / m² (IDR 6M – 8M).
- What you get: Local finishes, standard ceramic tiles, basic pool.
- Luxury Villa (Resort Standard): $900 – $1,500 / m² (IDR 15M – 25M).
- What you get: Imported stone/marble, commercial-grade waterproofing, smart home integration, designer architecture.
- Swimming Pool: Add ~$118 / m² of pool area.
🧱 Building from scratch? Check our detailed breakdown of materials and labor rates in our guide to Bali Villa Construction
Calculating the “Real” Price (Hidden Costs)

When budgeting, never look at the listed price in isolation. In Bali, the “sticker price” rarely includes the mandatory acquisition taxes.
A common mistake is assuming a flat rate for all purchases. In reality, taxes depend on whether you are buying a Resale Property or a New Developer Unit.
Example: New Developer Unit (Full Tax Load)
- Resale Market (Secondary): You typically pay ~6-7% (BPHTB + Notary), as VAT (PPN) usually does not apply to individual sellers.
- New Developer Market: You typically pay ~16-17% (BPHTB + Notary + 11% VAT).
🧾 Confused about taxes? Ensure you understand the rules with our complete guide on Bali Investor Guide 2026: Visas, Taxes & Legal Setup.
Limitations, Alternatives & Professional Guidance

While price lists are helpful, they are averages. The Bali market is hyper-local, prices can drop 30% just by crossing a street from a “Pink Zone” (Tourism) to a “Green Zone” (Agriculture).
Limitations of This Report

- Asking vs. Transacted: The prices in this report reflect Asking Prices from current market listings. Actual transaction values are typically 5–15% lower after negotiation.
- Leasehold Terms: A price of 5M/m² for a 20-year lease is expensive compared to 6M/m² for a 30-year lease. Always calculate the Annualized Cost to compare fairly.
- Currency Fluctuation: All USD estimates assume an updated Q1 2026 exchange rate of ~16,981 IDR/USD

📜 Leasehold vs. Freehold? Understand how ownership titles impact price in our guide to Can Foreigners Buy Property in Bali?
Professional Guidance & Legal Warnings
⚠️ Disclaimer: Not Legal Advice
This report provides market analysis and pricing data for informational purposes only. It does not constitute legal or financial advice. Regulations in Indonesia (including zoning, taxes, and foreign ownership) are subject to change and local interpretation. Always consult a qualified Notary (PPAT) or legal counsel before signing agreements.
CRITICAL LEGAL CAVEATS
- Nominee Arrangements are Illegal: Using a local citizen as a “Nominee” to hold Freehold title is void by law and unenforceable (Basic Agrarian Law No. 5 of 1960, Supreme Court Decision No. 3020 K/Pdt/2014). Always use the PT PMA structure for legal foreign ownership.
- Mandatory Zoning Verification: Never buy land without checking the ITR (Spatial Plan). Government enforcement is increasing; notably, the July 21, 2025 crackdown saw villas on Bingin Beach demolished for violating setback and zoning laws. Ensure your land is in the “Pink Zone” (Tourism) if you intend to rent it daily.
Methodology

This report was compiled using a forensic approach to data verification to ensure accuracy for the Q1 2026 market.
- Data Sources:
- REID (Real Estate Indonesia Data): Used for Transaction Trends (e.g., the +51% YoY growth).
- Rumah123 & BaliException: Used for Listing Data (Asking Prices) across Canggu, Seminyak, and Uluwatu.
- Bank Indonesia (BI): For macro-economic context and housing indices.
- Exchange Rate: All conversions use the Bank Indonesia JISDOR rate of 16,981 IDR/USD (Snapshot Date: Jan 20, 2026).
- Definitions: “Premium Land” refers strictly to Tourism/Residential (Yellow/Pink) zoned land suitable for foreign development. “Market Median” refers to the broader statistical average, including unzoned or agricultural plots.
Lets Meet
Conclusion

We believe the 2026 data is clear: The market has split. You either pay for the safety and liquidity of Canggu, or you invest in the growth potential of Uluwatu.
If you want the highest potential returns, the data points away from the saturated streets of Canggu and toward the rising limestone cliffs of Uluwatu. By entering this market at $295–$470 per m² (land), you secure an asset with significant room for appreciation, while enjoying rental rates that rival the most expensive parts of the island.
At COCO Development Group, we selected Uluwatu for our Azoria project because our data indicates the infrastructure gap is closing faster than land prices are rising, creating a unique window for double-digit appreciation.
👉 Secure your foothold:
Frequently Asked Questions (FAQ)

The average price varies wildly by location. In prime tourist hubs like Canggu, expect 9M–14M IDR ($530–$825) per m². In developing high-yield areas like Uluwatu, averages are 5M–8M IDR ($295–$470) per m².
In 2026, the median price for a 2-bedroom villa is approximately $245,000, with a typical range of $120,000 to $600,000 depending on location and luxury level.
Apartments command a premium (approx. $3,300/m² vs. $1,800/m² for villas) because they often include extensive amenities (security, gyms, pools) and professional management, which reduces the owner's workload and boosts occupancy.
No. Even in Bali's most expensive areas, luxury property prices (land + build) average $2,000–$3,500 per m². Comparable coastal luxury property in Spain, Portugal, or Greece typically trades at $5,000–$10,000 per m².
Usually, no. Listed prices are "Net to Seller." Buyers typically pay a 1% Notary Fee and, depending on the structure, may be liable for VAT (11%) on new builds or BPHTB (5%) on transfers.
References & Official Sources
- Government Regulations:
- PP No. 103/2015 (Ownership of Residential Houses or Occupancy by Foreigners).
- Permen ATR/BPN No. 29/2016 (Procedures for Granting, Releasing, or Transferring Rights).
- Law No. 5 of 1960 (Basic Agrarian Law).

Rasmus Holst is a serial entrepreneur and Co-Founder of COCO Development Group, where he helps drive innovation and growth through strategic business development. He is also the Co-Founder of Estate of Bali and Regnskabshelten.dk, Denmark’s fastest-growing accounting firm, which grew to 35 employees and generated $2.5M in turnover in 2023. Rasmus is passionate about building businesses that create long-term value and impact.